
Blood sugar swings after 40 have been genuinely contested in the research, and the picture shifted last month. An October 2026 SWAN analysis found insulin resistance rose about four times faster during a four-year window around the final period — 1.2% a year before the transition, 4.3% during it, 0.9% after. That reverses what the same cohort previously concluded. Until this year, SWAN and the American Heart Association attributed midlife glucose and insulin changes to chronological aging rather than to menopause itself.
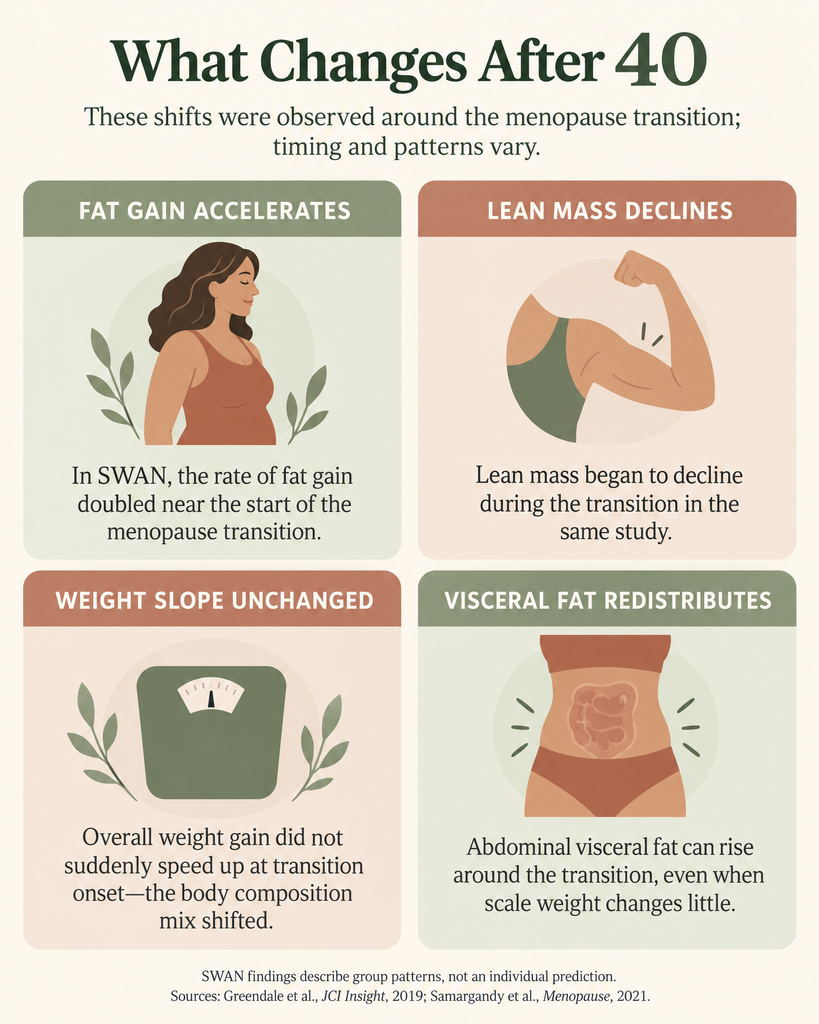
During the transition, fat mass gain accelerated from 1.0% to 1.7% a year while lean mass began to decline — and the weight slope didn’t change at all. And sleep is the clearest causal evidence in this whole area. In a randomized trial, restricting sleep to 6.2 hours raised insulin resistance 14.8% overall and 20.1% in postmenopausal women, largely independent of weight change.
Blood sugar swings after 40 are described to me in almost identical words every year: the same dessert that used to be fine now produces an hour of jitteriness and a crash, and the recovery takes longer than it used to.
That experience is real. What’s less settled is why — and this is a topic where the confident version you’ll read online has been overtaking the evidence for years. Here’s the accurate picture, including the parts that cut against the usual narrative.
The new finding. In October 2026, a SWAN analysis published in JCI Insight followed 1,315 women across up to 16 visits, measuring insulin resistance up to 12 times each. It found that HOMA-IR increased faster over a four-year window running from 1.5 years before the final menstrual period to 2.5 years after. For a modelled reference woman, the annualized increase went from 1.2% before the transition, to 4.3% during it, to 0.9% after.
The authors describe this as consistent with an independent effect of the menopause transition. It’s the strongest evidence yet that something specific to the transition is happening.
Why that’s notable. Because until this year, the dominant conclusion from the same cohort was the opposite. A 2009 analysis of 3,302 SWAN women found that glucose and insulin changes tracked chronological aging rather than the transition, while cholesterol changes tracked menopause. SWAN’s own 2019 progress report and the AHA’s 2020 scientific statement both said menopause was not independently linked to insulin or glucose increases beyond age.
So the honest statement is: insulin resistance does appear to accelerate around the transition, this is new evidence, it’s observational, it uses a calculated estimate rather than a direct measurement, and the field has not finished arguing about it.
What has never been contested. The body composition change. SWAN’s DXA data found that during the transition, fat mass gain accelerated from about 1.0% a year to 1.7%, while lean mass went from slowly increasing to slowly declining. Over the roughly three-and-a-half-year transition that’s about 1.6 kg of fat gained and a small amount of lean mass lost.
And here’s the detail worth the whole article: the weight slope showed no change at the onset of the transition at all. Fat gain was offset by lean loss, so the scale and BMI simply didn’t register it. The AHA statement notes separately that the two-odd kilograms women gained over three years in two cohorts was not related to menopausal status.
It’s redistribution, not gain. That’s also why the mirror and the scale disagree.
Why redistribution matters for dessert. Skeletal muscle is the main site where glucose from a meal is taken up, and visceral fat is the fat depot most associated with insulin resistance. A cross-sectional comparison found intra-abdominal fat area 49% greater in early-postmenopausal than premenopausal women, and that difference held after adjusting for both age and total fat mass — while the subcutaneous difference did not.
Three claims you’ll see constantly that the evidence doesn’t support.
“Menopause raises your diabetes risk.” This is the one most at odds with the data. A UK Biobank cohort of 146,764 women followed a mean of 14.5 years found adjusted hazard ratios of 1.00 for early menopause and 0.97 for premature menopause compared with normal timing, and no excess risk with surgical menopause. The Menopause Society’s own medical director said the elevated diabetes risk in postmenopausal women “does not appear to be related to the age at menopause onset.” The Diabetes Prevention Program found the same: after age adjustment, neither natural menopause nor oophorectomy predicted diabetes.
Crude incidence by modifiable factor told a different story — obesity 10.8%, smoking 7.5% — against 4.2% for normally timed menopause.
Note that metabolic syndrome is genuinely different. A SWAN analysis found the odds of developing it rose 45% per year during perimenopause, independent of aging and of BMI change. Don’t conflate the two.
“Falling estrogen is the driver.” In that same SWAN analysis, change in estradiol was not a significant predictor of metabolic syndrome — an odds ratio of 0.97, which the authors called “at best, a weak and nonsignificant predictor.” What did predict it was rising bioavailable testosterone and falling SHBG. Much of the estrogen mechanism work is in rodents, and in gold-standard clamp studies estrogen mostly showed no systemic insulin-sensitivity benefit at all — one trial found it got slightly worse.
“It’s cortisol.” The Swiss Perimenopause Study followed 127 women aged 40 to 56 with repeated saliva sampling and found cortisol did not rise across the transition. No major body identifies cortisol as a primary driver here.
“The scale didn’t move because fat gain and muscle loss cancelled out. That’s not reassurance — it’s the whole mechanism hiding in plain sight.”
Bigger carbohydrate loads, more often, over a six-week stretch rather than one evening.
Sleep disruption, which is where the strongest causal evidence sits. A randomized crossover trial restricted 40 women from 7.5 to 6.2 hours a night for six weeks. Insulin resistance rose 14.8% overall — and 20.1% in the postmenopausal women — largely independent of body weight change, and normalised once habitual sleep resumed. That’s the most convincing single result in this entire topic, and the holidays are a short-sleep season layered on a phase where sleep is already unreliable.
Alcohol, which costs you the back half of the night.
Less movement, in the darkest, busiest weeks of the year.
More sitting after meals, when a short walk would do the most good.
| Conventional Approach | Root-Cause Approach | |
| Framing | “You’re eating too much” | Composition changed; the scale hides it |
| Testing | Fasting glucose alone | A1C and fasting glucose, with their limits understood |
| Weight | The main measure | Less informative than waist and strength |
| Sleep | Unaddressed | The best-evidenced lever in this phase |
| Diabetes risk | Blamed on menopause | Driven by the modifiable factors, not the timing |
I’ve ordered these by the strength of the evidence, not by how often they’re recommended.
1. Protect sleep — this has the best causal evidence. The randomized trial above showed that six weeks at 6.2 hours raised insulin resistance by around 15%, and 20% in postmenopausal women, independent of weight. It also reversed. If night sweats are breaking your sleep, that’s worth treating in its own right rather than absorbing.
2. Walk after large meals. Muscle contraction takes up glucose without needing insulin to do it. Ten minutes after holiday dinner is disproportionately effective for the effort.
3. Eat the dessert after the meal, not instead of it. Protein, fat and fiber first flattens what the sugar does afterward, and you give up nothing.
4. Keep moving and keep training — for the right reasons. I want to be straight here, because this is usually oversold. In a 12-month randomized trial of 439 postmenopausal women, dietary weight loss improved HOMA-IR by 24% while aerobic exercise alone changed it by 9%, which was not statistically significant.
A meta-analysis in postmenopausal women found a modest insulin benefit at three to four months that had disappeared by six to twelve. And I could find no well-powered trial of resistance training with insulin sensitivity as a primary endpoint in perimenopausal women specifically.
Train anyway. It’s the best thing available for the lean mass that’s actually declining, for waist circumference, for bone and for cardiovascular risk — and in SWAN, low grip strength predicted diabetes risk. Just don’t expect it to fix insulin sensitivity on its own.
5. Eat a Mediterranean-style pattern. In the Women’s Health Study, 25,317 women with a mean baseline age of 52.9 were followed nearly 20 years. High adherence was associated with a 30% lower risk of developing diabetes, attenuating to 15% after BMI adjustment — and insulin resistance accounted for about 65% of the association. Observational, but large, long, and in exactly this age group.
6. Don’t assume more protein helps your blood sugar. This one surprises people. In a fully fed randomized trial in postmenopausal women with obesity, weight loss at 0.8 g of protein per kg improved insulin sensitivity by 25 to 30% — while the group at 1.2 g/kg saw no improvement at all, for a lean mass difference of about one pound that the investigators themselves questioned. It’s a small trial of 34 women, and it doesn’t make protein bad. But “more protein improves insulin sensitivity in menopausal women” isn’t an established claim, and I’m not going to present it as one.
7. Don’t restrict your way through December. Under-eating during the day and arriving at an evening party ravenous produces a bigger swing than eating normally would have.
8. Skip the supplements marketed for this. I looked for authoritative support for any supplement for insulin resistance in menopause and found none — every result was commercial. NCCIH’s assessment of supplements for menopausal symptoms generally is that none has clearly been shown to be helpful, and it flags rare liver injury with black cohosh and potential harm with DHEA.
The validated screening path is straightforward. The US Preventive Services Task Force gives a Grade B recommendation to screen adults aged 35 to 70 with overweight or obesity using fasting plasma glucose, A1C, or a two-hour glucose tolerance test, roughly every three years if results are normal. Prediabetes is an A1C of 5.7 to 6.4% or a fasting glucose of 100 to 125 mg/dL.
Two honest caveats.
A1C isn’t universally reliable. The NIDDK notes it can be unreliable in certain types of anemia and other blood disorders — relevant in perimenopause, where heavy bleeding and iron deficiency are common. If your A1C and glucose results don’t match each other, A1C may not be the right test for you.
Fasting insulin and HOMA-IR are research instruments, not screening tests. They’re how nearly all the menopause research above was done, including that new SWAN analysis — so they’re genuinely informative about the question. But no guideline body includes them in diagnostic or screening criteria, there are no validated cut-points, and assays aren’t standardised between labs. The sharpest illustration: in the hormone therapy literature, HOMA-IR said estrogen improved insulin sensitivity while clamp studies said it didn’t. Useful context, not a verdict.
Because it comes up, and because the honest version has more fences than the popular one.
The Women’s Health Initiative found estrogen plus progestin reduced self-reported treated diabetes with a hazard ratio of 0.81, and estrogen alone 0.86. HERS found a 35% reduction. Those are real findings — and: diabetes was a secondary endpoint in every trial, HERS wasn’t powered for it and had a mean participant age of 67, the WHI reductions dissipated by 13 years of follow-up, the USPSTF concludes there’s no net benefit to hormone therapy for primary prevention of chronic conditions, and The Menopause Society’s position statement says plainly that while hormone therapy reduces new-onset type 2 diabetes, it is not government approved for that indication. There are also no trial data at all on hormone therapy and cardiometabolic outcomes during perimenopause.
So: not a reason to start hormone therapy. If you’re considering it for symptoms, that’s a different and legitimate conversation with your provider.
Book a visit for new or worsening fatigue after meals, for cravings that feel different than they used to, for shape change despite no change in habits, for irregular cycles alongside these symptoms, or if you have a family history of type 2 diabetes and haven’t been screened.
Also worth a visit for night sweats or sleep disruption affecting your days, for new hair thinning or feeling cold, or if you’ve been told your bloodwork is normal and still don’t feel like yourself.
Seek care promptly for excessive thirst with frequent urination, unexplained weight loss, blurred vision, or shakiness and confusion that resolves with eating.
Does menopause cause insulin resistance? The evidence genuinely shifted this year. An October 2026 SWAN analysis found insulin resistance rising about four times faster during a window around the final period, which is the first strong evidence for an independent effect — but the same cohort previously attributed these changes to aging, it’s observational, and the question isn’t settled.
Does menopause raise my diabetes risk? The best outcome data say no, not independently. A UK Biobank cohort of nearly 147,000 women found no excess risk by menopause timing or type after adjustment. Obesity and smoking carried far more risk than menopause timing did.
Why hasn’t my weight changed if my body has? Because that’s what the data shows. SWAN found no change in the weight slope at the transition, while fat gain accelerated and lean mass declined. The composition shifted more than the number.
Isn’t this all about falling estrogen? Less than you’d think. In SWAN, change in estradiol was not a significant predictor of metabolic syndrome — bioavailable testosterone and SHBG were.
Should I get my fasting insulin checked? It’s informative, and it isn’t a validated screening test. The guideline path is A1C, fasting glucose or a glucose tolerance test. If you want fasting insulin for a fuller picture, that’s reasonable — just don’t treat the number as a diagnosis.
What’s the single highest-value change for blood sugar swings after 40? Sleep. It has the best causal evidence of anything in this article, and it’s the one the holidays attack hardest.
Blood sugar swings after 40 are neither a discipline problem nor quite the hormonal catastrophe the internet sells them as. The best-documented change is in body composition — more fat, less muscle, often at a similar weight — and the strongest evidence for anything you can do about it points at sleep, not supplements.
Sleep seven hours. Walk after dinner. Put the sweet thing at the end of the meal. Keep training, for the muscle and the bones rather than for a HOMA-IR number. And be skeptical of anyone selling you a menopause metabolism protocol, because the AHA’s own statement notes there are no lifestyle trials stratified by menopausal stage to build one from.
“Sleep is the lever with the best evidence behind it. It’s also the first thing December takes.”
Whether this is your first visit or your next one, if the swings have become a daily feature, screening is a straightforward place to start.
Do Sweets Hit Differently Than They Used To? Our team would love to meet with you.
Click this link to schedule a time to meet with our team.
Related: Natural Remedies for Hot Flashes | Why Your Annual Bloodwork Can Look “Normal” and You Still Feel Off | The Office Candy Bowl: Why Sugar Wrecks Your 3 PM Energy